EAS 270: What You Should be able to Deduce from Weather Maps (by the end of term!)
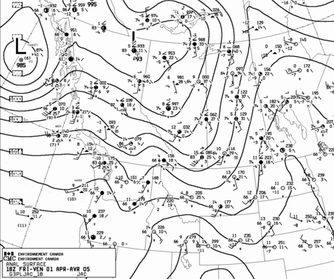
- Surface Analysis
- From station report/symbols (Appendix C of Aguado & Burt) decode
- temperature T and dewpoint temperature Td
- fraction of sky covered (recognize qualitative degree of cover: none, less than half, half, almost overcast, overcast)
- the most common and significant present weather symbols (intermittent drizzle, rain, snow; continuous drizzle, rain, snow)
- wind direction & speed
- local sea-level-corrected pressure
- 3 hour pressure tendency
- approximate estimate of direction of motion of surface system (inferred from pressure trends)
- determine dominant system (if any) for local weather
- judge whether local weather is static ("no weather") or in state of development
- 850 mb Analysis
- from station report
- height of the 850 mb surface
- wind direction and speed aloft
- T, T-Td
- identify whether there is substantial spatial variation of T... which potentially could imply rapid temperature changes if the winds were to develop
- are there regions where isotherms are packed so tightly that we might speak of a ``front''?
- identify regions of strong positive (warm) or negative (cold) temperature advection
- 750 mb Analysis
- decode station report
- identify regions of strong positive (warm) or negative (cold) temperature advection
- identify regions of high humidity and/or strong humidity advection
- 500 mb Analysis
- from station report
- height of the 500 mb surface
- wind direction and speed aloft
- T, T-Td
- identify whether there is substantial spatial variation of 1000-500 thickness.
- identify regions of strong positive (warm) or negative (cold) thickness advection
- positions of ridges and troughs affecting local weather
- distinguish long waves and short waves
- Satellite Photographs
- identify higher (colder) and lower (warmer) clouds, and cloud-free regions
- relate cloud patterns to maps
- Thermodynamic chart (skew T - log P diagram)
- be able to plot T and Td versus p; be able to read off T, Td at any given p
- diagnose proximity to saturation of any layer
- identify the families of lines on the diagram - lines of constant pressure (isobars), isotherms, dry and moist adiabats
- diagnose the stability of any specified layer
- recognise inversion layers
- recognise well-mixed layers
- From the ensemble of maps
- what is/are the dominant systems as far as Alberta's weather is concerned
- what are the probable short term trends, given what you estimate to be the likely nature of the diurnal cycle and the existing synoptic patterns?
Back to the EAS270 home page.
Last Modified: 6 Oct. 2006