EAS372 Weather Analysis and Forecasting: USEFUL WEB SITES
Newly discovered
Forecasters' Discussions & CMC Prog & Cdn Radar
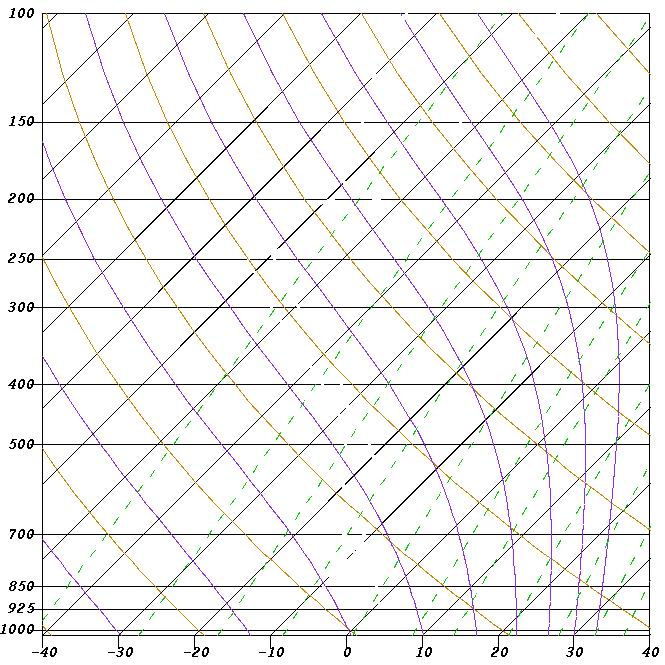
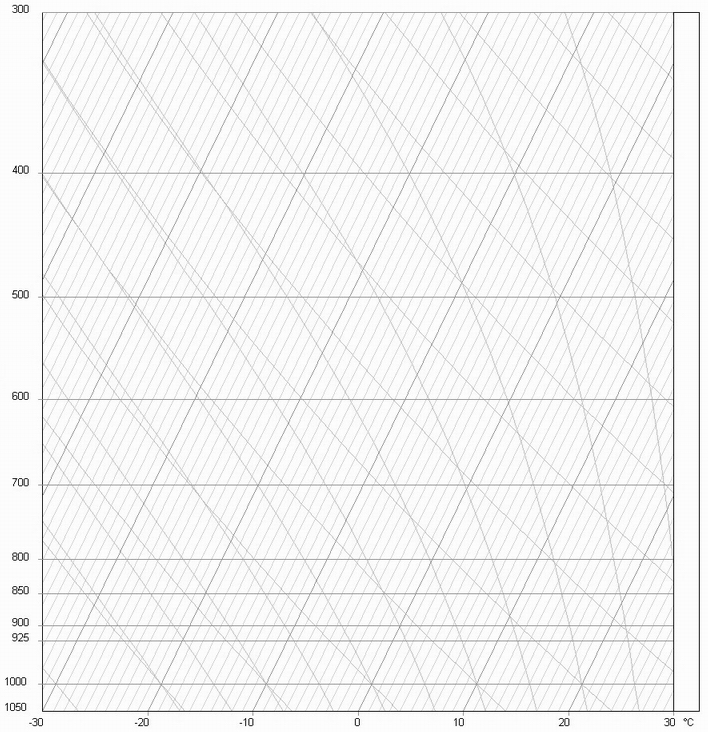
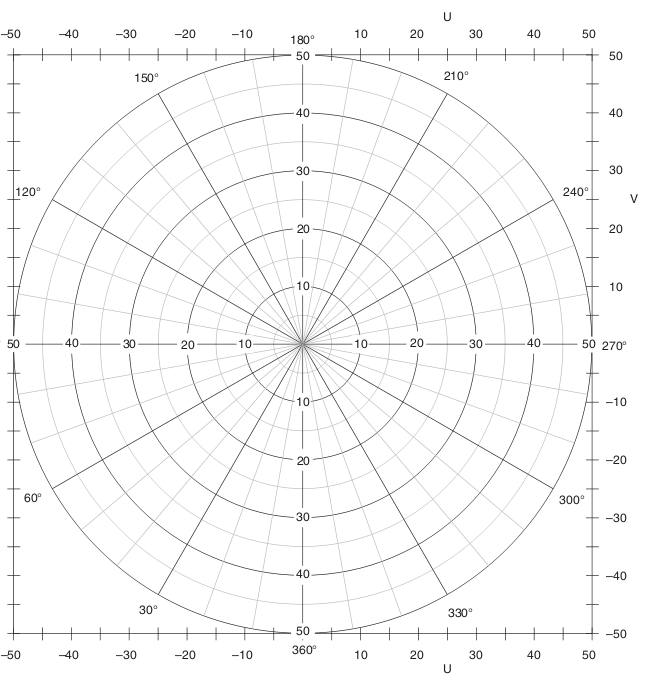
Sounding/hodographs/cross-section
- Nearby stations: Edmonton-WSE sounding ID is 71119; Prince George-ZXS 71908; Fort Smith-YSM 71934; Kelowna-YLW 71203; The Pass-YQD 71867; Churchill-YYQ 71913; Great Falls Montana-TFX 72776; Glasgow-Montana-GGW 72768
- Atmospheric soundings via U. Wyoming (select skew-T as .gif or .pdf). This site provides a long archive, and option of a hodograph. To store sounding data in format suitable for RAOB, paste the data into a text file, e.g. use Notepad -- here's an example
- Edmonton sounding (larger format; from U. Ohio; other stations)
- U. Ohio archived soundings for Edmonton (and access to other stations - SITE TEMPORARILY DOWN)
- U. Ohio OSU Weather. For US & Canadian soundings select "Upper Air." This site also offers beautiful animations of the GOES images, and much else.
- Atmospheric Soundings (via NCAR/UCAR; + hodograph)
- Archive of soundings (select by WMO station identifier, e.g. 71119; use FSL format to cut and paste into a file suitable for RAOB under Windows; use NetCDF format for file suitable for input to McIDAS)
- NOAA site giving radiosonde (RAOB) and model soundings:
- For model forecast soundings, select model wanted; and specify location (e.g. WSE).
- For example, select GFS (forecast soundings to 5-day) or NAM (to 15-hr) and specify (e.g.)
- For Edmonton International Airport enter CYEG (or 71123)
- For Calgary Airport CYYC (or 71877)
- For radiosonde sounding select "RAOBs", the time wanted, and location, e.g. WSE (or 71119)=Edmonton. (Long archive available)
- (Aircraft soundings are not accessible)
- Soundings with rapid choice of Skew T/Stuve/Text/Hodograph (go to Upper Air Soundings US, thence to Canada)
- Cross-section, computed live: U.S. only?
NWP (and analyses)
- Meteocentre (UQAM, Montreal). Display and compare NWP models (GEM, WRF, NAM, ECMWF,...). Also provides Meteograms for Cdn cities
- Very fast and flexible access to many models (College of DuPage, NexLab)
- Canadian Products (GEM model)
- USA's NCEP products (GFS, WRF-NAM)
- WRF-NAM surface analysis
- GFS (to 16 days) and WRF-NAM (to 3.5 days) forecasts
- Access to several US weather models, including RUC, NAM, GFS from TwisterData.com (nice images, including vert. veloc; and provides forecast soundings)
- Access to several US and UKMET models via U.Wyoming. Select Region: North America (note: this site allows selection of regions all over the world). Numerous meteorol. fields can be selected, including horizontal divergence and temperature advection...
- NAM meteograms for specific locations (Edmntn Int'l 711230, Stony Pln 711190)
- Rapid Refresh (13 km, every 3 hr to 24 hr)
- NCEP model graphics. This page archives NCEP model outputs for one week, so if you missed a chart from a few days back you can probably make do with something from here. Outputs available include the models' surface fluxes/energy balance, and many other useful fields (e.g. Omega)
- NAM/Wrf via Unisys
- Unisys site for graphical weather information (includes progs from many models)
- 84-hour Forecast for North America (CRAS45NA assimilates GOES sounder water vapor and clouds; exchange 12 for 00 to get f/cst initialized at 00Z)
- UK Meteorol. Office (UKMET model)
- European Centre for Medium Range Weather Forecasting (ECMWF)
- URL's for technical specification of various NWP models
Satellite Images, Sea/ice & snow analyses...
Reanalysis and/or Archive sites
- NOAA Reanalysis. Permits to create (e.g.) charts of climatological mean height contours (and much else). Example: to create monthly mean 700 hPa height contours for Feb. 2011: → Interactive plotting and Analysis → Monthly/Seasonal Mean Composites or Daily Mean Composites
- NOAA's National Climatic Data Center (NCDC) NOMADS (Nat'l Op'l Model Archive & Distrib'n System). Links allow to rebuild an analysis or prog from archived data, with a wide range of variables to choose from, including vertical velocity veloc. Example (700 hPa analysis): Access → NAM → Near real time & historical NAM → Plot | FTP4u → pick time window → build order → plot data → Advanced users → next page → select fields eg. to get 700 hPa height contours select "geopotential height -[gpm] - 39 levels", select "draw lines"
- NCEP reanalyses (Daily and Monthly Values for 1948/01 - present... not sure this is useful)
- Plymouth State Weather Centre (links allow to construct weather maps from archived data, going back to about 1990)
- Create typical synoptic chart for mandatory levels (back to 1998. Can plot many fields, incl. divergence)
- Unisys Image and Map Archive, e.g. ETA and/or NAM 0h analysis in form of (garish) 4-panel colour charts back to 2004
- Accessing .grib files for the reanalyses
-
- via soostrc.comet.ucar.edu/data/grib/ (Available: cfsr, ecmwf, gfs, ice, nam, namak, narr, rap, ruc, sst)
- apps.ecmwf.int/datasets/data/interim_full_daily/ ECMWF interim reanalysis (global, 0.7 degree)
- nomad2.ncep.noaa.gov/ncep_data/ (identical sites with "nomad3" or "nomad" in lieu of "nomad2"). Go to NCEP/DOE Reanalysis (Reanalysis-2) and (e.g.) in first row select "ftp2u" to access selection page for wanted times/levels/variables. Can restrict the lat/lon range. Available variables: ABSV, HGT, PRATE, PRES, RH, TMP, UGRD, VGRD, VVEL
Parcel Trajectories (forward or backward in time)
Comprehensive Sites oriented to the (North American) General Public
Tools
On-line Case Studies of Weather Events
Miscellaneous sites/documents related to thermal soaring (hang gliding, paragliding, etc.)
Australia/New Zealand
Europe
Miscellaneous
Back to the EAS372 home page.
Last Modified: 21 Aug., 2013