EAS372 Weather Analysis and Forecasting: USEFUL WEB SITES
Newly discovered
Forecasters' Discussion
NWP (and analyses)
- Vizaweb MSC progs (3hr steps; username=vizaweb, password=vizaweb)
- Meteocentre (UQAM, Montreal). Display and compare NWP models (GEM, WRF, NAM, ECMWF,...). Also provides Meteograms for Cdn cities
- Very fast and flexible access to many models (College of DuPage, NexLab)
- Canadian Products (GEM model)
- USA's NCEP products (GFS, WRF-NAM)
- HRRR (High resolution rapid update) 3 km cloud-resolving model (choose NW domain)
- GFS (to 16 days) and WRF-NAM (to 3.5 days)... and other guidance
- NWS WRF-NAM surface analysis
- Access to several US weather models, including RUC, NAM, GFS from TwisterData.com (nice images, including vert. veloc; and provides forecast soundings)
- NCEP progs (& ECMWF) via Ohio State... but only to ~60oN)
- Access to several US and UKMET models via U.Wyoming. Select Region: North America (note: this site allows selection of regions all over the world). Numerous meteorol. fields can be selected, including horizontal divergence and temperature advection...
- NAM meteograms for specific locations (Edmntn Int'l 711230, Stony Pln 711190)
- Rapid Refresh (13 km, every 3 hr to 24 hr)
- NCEP model graphics. This page archives NCEP model outputs for one week, so if you missed a chart from a few days back you can probably make do with something from here. Outputs available include the models' surface fluxes/energy balance, and many other useful fields (e.g. Omega)
- NAM/Wrf via Unisys
- Unisys site for graphical weather information (includes progs from many models)
- EAS U. Albany NAM-based colour 4-panel charts (not necess. up to date). Includes theta & wind on tropopause.
- 84-hour Forecast for North America (CRAS45NA assimilates GOES sounder water vapor and clouds; exchange 12 for 00 to get f/cst initialized at 00Z)
- UK Meteorol. Office (UKMET model)
- European Centre for Medium Range Weather Forecasting (ECMWF)
- URL's for technical specification of various NWP models
Sounding/hodographs/cross-section/metars
Nearby stations: Edmonton-WSE sounding ID is 71119; Prince George-YXS 71908; Fort Smith-YSM 71934; Kelowna-YLW 71203; The Pass-YQD 71867; Churchill-YYQ 71913; Great Falls Montana-TFX 72776; Glasgow-Montana-GGW 72768
- Atmospheric soundings via U. Wyoming (select skew-T as .gif or .pdf). This site provides a long archive, and option of a hodograph. To store sounding data in format suitable for RAOB, paste the data into a text file, e.g. use Notepad -- here's an example
- Edmonton sounding (larger format; from U. Ohio; other stations)
- U. Ohio OSU Weather. For US & Canadian soundings select "Upper Air." This site also offers beautiful animations of the GOES images, and much else.
- Atmospheric Soundings (via NCAR/UCAR; + hodograph; no archive)
- Archive of soundings (select by WMO station identifier, e.g. 71119; use FSL format to cut and paste into a file suitable for RAOB under Windows; if downloaded on Linux machine use unix2dos command in a terminal to convert; use NetCDF format for file suitable for input to McIDAS; no hodograph)
- NOAA site giving radiosonde (RAOB) and model soundings:
- For model forecast soundings, select model wanted; and specify location (e.g. WSE or CYEG ot 71119). Select HTML5 plot.
- For example, select GFS (forecast soundings to 5-day) or NAM (to 15-hr) and specify (e.g.)
- For Edmonton International Airport enter CYEG (or 71123)
- For Calgary Airport CYYC (or 71877)
- For radiosonde sounding select "RAOBs", the time wanted, and location, e.g. WSE (or 71119)=Edmonton. (Long archive available)
- (Aircraft soundings are not accessible)
- Soundings with rapid choice of Skew T/Stuve/Text/Hodograph (go to Upper Air Soundings US, thence to Canada)
- Cross-section, computed live: U.S. only?
- Nav Canada (go here for METARs,PIREPs, etc.)... Wikipedia on METAR interpretation
- Archived METARs (longer record to 60 hours)
- Archived METARs (Iowa Environmental Mesonet)
- Nav Canada weather codes and symbols (ie. definition of symbols used on CMC charts)
- Weather symbols chart from Weather Graphics WeatherSymbols.gif (or as much larger file including other information, wxchart.pdf)
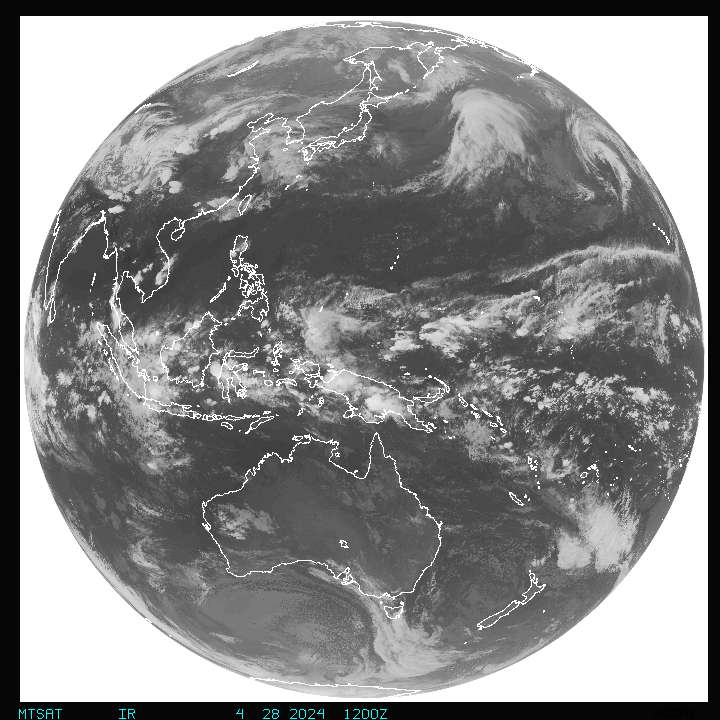
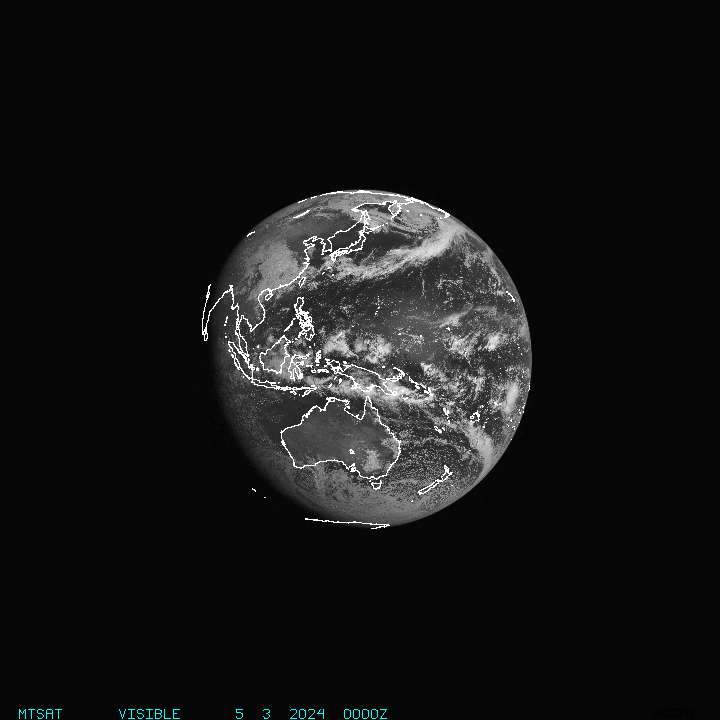
Satellite Images, Sea/ice & snow analyses...
Reanalysis and/or Archive sites
- Overview
- Overview of available reanalysis datasets
- Accessible as of Feb. 2015, the following sites generate single-field plots [00/06/12/18Z or daily mean or monthly mean] for a basic set of variables (heights, temps, omega,...). Choosing 190E to 290E brackets our range of longitudes.
- NCEP Reanalysis 1 1948/01 to present, e.g. 700 hPa contours for 06Z Saturday 31 Jan. 2015 (and corresponding omega at 700 hPa).
- NCEP Reanalysis 1 (daily and monthly means for 1948/01 - present)
- NCEP Reanalysis 2 1979/01 to 2014/06.
- NOAA PSD (Physical Sciences Division) Interactive Plotting and Analysis Pages. Create (e.g.) charts of climatological mean height contours (and much else). Example: to create monthly mean 700 hPa height contours for Feb. 2011: → Interactive plotting and Analysis → Monthly/Seasonal Mean Composites or Daily Mean Composites
- NCEP Climate Forecast System Version 2 (CFSv2) 2011/01 to present (almost real time).
- NOAA's National Climatic Data Center (NCDC) NOMADS (Nat'l Op'l Model Archive & Distrib'n System). Links allow to rebuild an analysis or prog from archived data, with a wide range of variables to choose from, including vertical velocity veloc. Example (700 hPa analysis): Access → NAM → Near real time & historical NAM → Plot | FTP4u → pick time window → build order → plot data → Advanced users → next page → select fields eg. to get 700 hPa height contours select "geopotential height -[gpm] - 39 levels", select "draw lines"
- Plymouth State Weather Centre allows to create synoptic charts for mandatory levels, 1998-present. Can plot a great variety of interesting meteorological fields, including divergence (but, curiously, not vertical velocity); and can include a secondary field. Usually best to make the height field the secondary field. Example, 700 hPa height and moisture convergence valid 00Z Saturday Jan. 31, 2015.
- Unisys Image and Map Archive, e.g. ETA and/or NAM 0h analysis in form of (garish) 4-panel colour charts back to 2004
- Accessing .grib files for the reanalyses
- via soostrc.comet.ucar.edu/data/grib/ (Available: cfsr, ecmwf, gfs, ice, nam, namak, narr, rap, ruc, sst)
- apps.ecmwf.int/datasets/data/interim_full_daily/ ECMWF interim reanalysis (global, 0.7 degree)
- http://nomads.ncep.noaa.gov/
- NWS DIFAX Weather Map Archive (full size)
- Archive of NCEP surface analyses (small charts)
- EC weather archive
- NCEP site to regenerate daily weather maps over N. America (archive to 2002; surface only, with fronts; maps do not cover north of 60oN). Also 7 day archive (archive to 2006; surface only, with fronts; option for maps covering entirety of N. America)
Parcel Trajectories (forward or backward in time)
Comprehensive Sites oriented to the (North American) General Public
Tools
On-line Case Studies of Weather Events
Miscellaneous sites/documents related to thermal soaring (hang gliding, paragliding, etc.)
Asia
Australia/New Zealand
Europe
Miscellaneous
- Worldwide Radiosonde Station List (with codes)
- Equilibrium vapour pressure table over a plane surface of liquid water. Here for sub-zero temperatures the equilibrium v.p. is computed with respect to water, which is the convention used with regard to the radiosonde data.
- Vapour pressure table (equilibrium vapour pressure over a plane surface of water or ice at the stated temperature; from Fritschen & Gay, "Environmental Instrumentation")
Back to the EAS372 home page.
Last Modified: 17 April, 2015