EAS372 Weather Analysis and Forecasting: USEFUL WEB SITES
Newly discovered
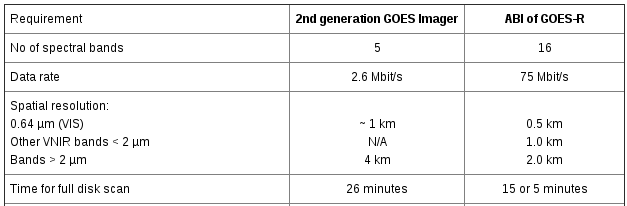
- GOES-R, "next-generation (3rd) geostationary weather satellite family of NOAA," with "ABI (Advanced Baseline Imager)... with greatly improved capabilities and features (more spectral bands, faster imaging cycles, and higher spatial resolution than the current imager generation of GOES-N to -P)."
- www.weather-forecast.com: oriented to the public, but with global coverage and some rather mice charts
- Alberta Agriculture: current Alberta weather; and climate
- Short-term archived of NCEP model runs (Colorado State U): "Just click on any of the images, and there is a menu for "previous runs" on the left-hand side that you can use to choose a previous model run". (Maps cut off just south of 60oN).
- Quasi-Geostrophic diagnostics (U. Arizona): isobaric charts of the RHS of the omega eqn and of the height tendency eqn evaluated from GFS fields; also, Q-vectors.
- earth.nullschool.net. A global, zoomable Google-Earth-like view of meteorological fields, 12 hour time increment.
- NCEP Outlook Maps, Graphs and Tables
- US analysis with fronts (NeXlab, College of DuPage, very high resolution)
- Surface analysis (archived, Meteocentre) & much else
- SpotWx (access to Scribe meteograms)
- American Met. Soc. AMS Datastreme (focused on US)
Forecasters' Discussion
NWP (and analyses)
- Vizaweb MSC progs (3hr steps; username=vizaweb, password=Bewaziv16!)
- Meteocentre (UQAM, Montreal). Display and compare NWP models (GEM, WRF, NAM, ECMWF,...). Turn on archives to go to older model runs. Also provides Meteograms for Cdn cities
- Very fast and flexible access to many models (College of DuPage, NexLab)
- Canadian Products (GEM model)
- USA's NCEP products (GFS, WRF-NAM)
- NWS Weather Prediction Center
- HRRR (High resolution rapid update) 3 km cloud-resolving model (choose NW domain)
- GFS (to 16 days) and WRF-NAM (to 3.5 days)... and other guidance
- Access to several US weather models, including RUC, NAM, GFS from TwisterData.com (nice images, including vert. veloc; and provides forecast soundings)
- NCEP progs (& ECMWF) via Ohio State... but only to ~60oN)
- Access to several US and UKMET models via U.Wyoming. Select Region: North America (note: this site allows selection of regions all over the world). Numerous meteorol. fields can be selected, including horizontal divergence and temperature advection...["This server lost its data drive on March 11 (2017). I am out of town for a week but am rebuilding the server as I find time."]
- NAM meteograms for specific locations (Edmntn Int'l 711230, Stony Pln 711190)
- Rapid Refresh (13 km, every 3 hr to 24 hr)
- NCEP model graphics. This page archives NCEP model outputs for one week, so if you missed a chart from a few days back you can probably make do with something from here. Outputs available include the models' surface fluxes/energy balance, and many other useful fields (e.g. Omega)
- NAM/Wrf via Unisys
- Unisys site for graphical weather information (includes progs from many models)
- EAS U. Albany NAM-based colour 4-panel charts (not necess. up to date). Includes theta & wind on tropopause.
- 84-hour Forecast for North America (CRAS45NA assimilates GOES sounder water vapor and clouds; exchange 12 for 00 to get f/cst initialized at 00Z; specifications of CRAS model)
- UK Meteorol. Office (UKMET model)
- European Centre for Medium Range Weather Forecasting (ECMWF)
- URL's for technical specification of various NWP models
Sounding/hodographs/cross-section/metars
Nearby stations: Edmonton-WSE sounding ID is 71119; Prince George-YXS 71908; Fort Smith-YSM 71934; Kelowna-YLW 71203; The Pass-YQD 71867; Churchill-YYQ 71913; Great Falls Montana-TFX 72776; Glasgow-Montana-GGW 72768
- Atmospheric soundings via U. Wyoming (select skew-T as .gif or .pdf). This site provides a long archive, and option of a hodograph. To store sounding data in format suitable for RAOB, paste the data into a text file, e.g. use Notepad -- here's an example
- Edmonton sounding (larger format; from U. Ohio; other stations)
- U. Ohio OSU Weather. For US & Canadian soundings select "Upper Air." This site also offers beautiful animations of the GOES images, and much else.
- Atmospheric Soundings (via NCAR/UCAR; + hodograph; no archive)
- Archive of soundings (select by WMO station identifier, e.g. 71119; use FSL format to cut and paste into a file suitable for RAOB under Windows; if downloaded on Linux machine use unix2dos command in a terminal to convert; use NetCDF format for file suitable for input to McIDAS; no hodograph)
- NOAA site giving radiosonde (RAOB) and model soundings:
- For model forecast soundings, select model wanted; and specify location (e.g. WSE or CYEG ot 71119). Select HTML5 plot.
- For example, select GFS (forecast soundings to 5-day) or NAM (to 15-hr) and specify (e.g.)
- For Edmonton International Airport enter CYEG (or 71123)
- For Calgary Airport CYYC (or 71877)
- For radiosonde sounding select "RAOBs", the time wanted, and location, e.g. WSE (or 71119)=Edmonton. (Long archive available)
- (Aircraft soundings are not accessible)
- Soundings with rapid choice of Skew T/Stuve/Text/Hodograph (go to Upper Air Soundings US, thence to Canada)
- Cross-section, computed live: U.S. only?
- Nav Canada (go here for METARs,PIREPs, etc.)... Wikipedia on METAR interpretation
- Archived METARs (longer record to 60 hours)
- Archived METARs (Iowa Environmental Mesonet)
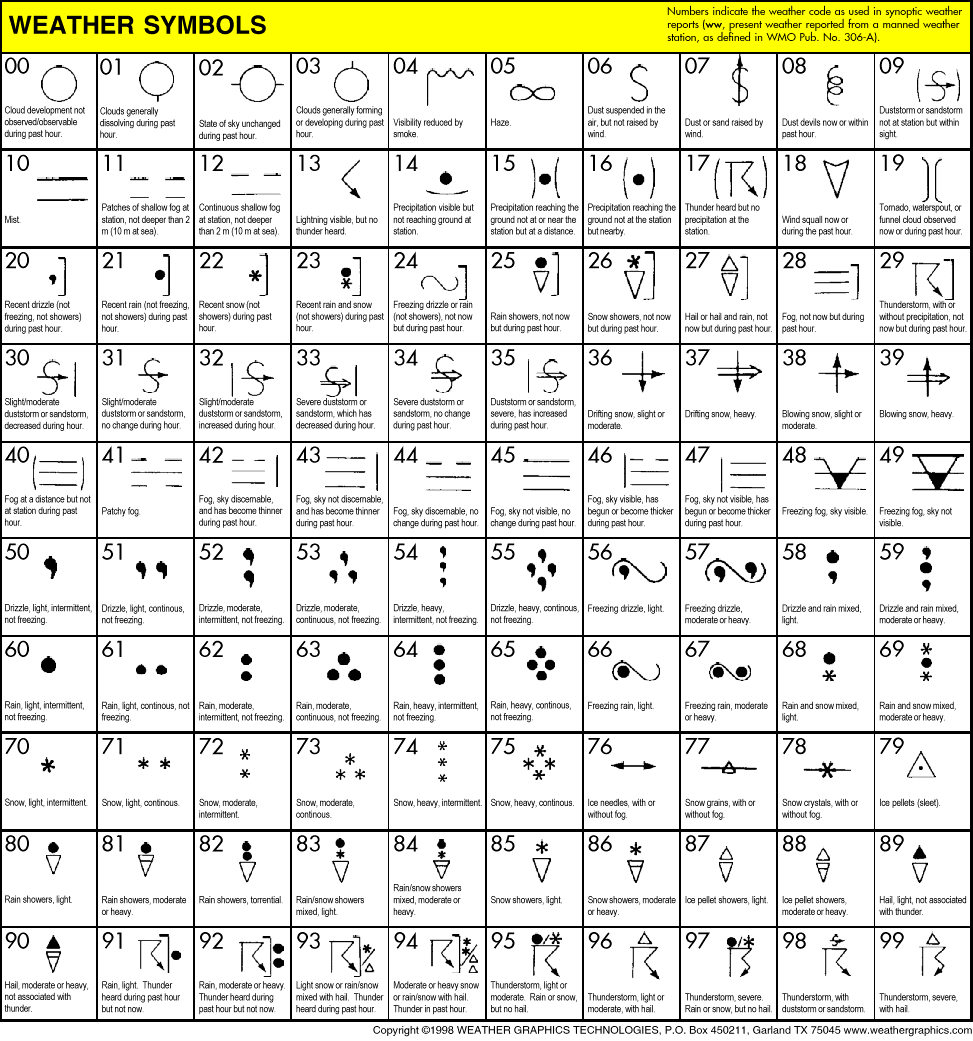
- Nav Canada weather codes and symbols (ie. definition of symbols used on CMC charts)
- Weather symbols chart from Weather Graphics WeatherSymbols.gif (or as much larger file including other information, wxchart.pdf)
Satellite Images, Radar, Sea/ice & snow analyses...
Reanalysis and/or Archive sites
- Canadian Historical Weather Radar
- Overview -- How to obtain/plot/analyze data
- Overview of available reanalysis datasets
- Accessible as of Feb. 2015, the following sites generate single-field plots [00/06/12/18Z or daily mean or monthly mean] for a basic set of variables (heights, temps, omega,...). Choosing 190E to 290E brackets our range of longitudes.
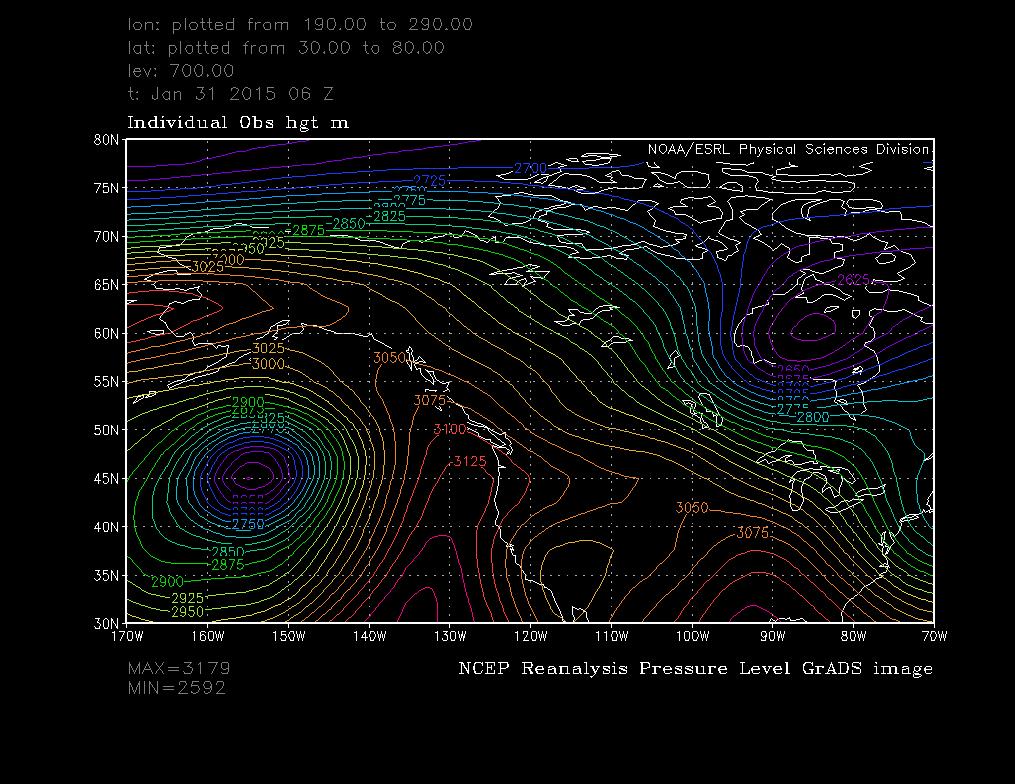
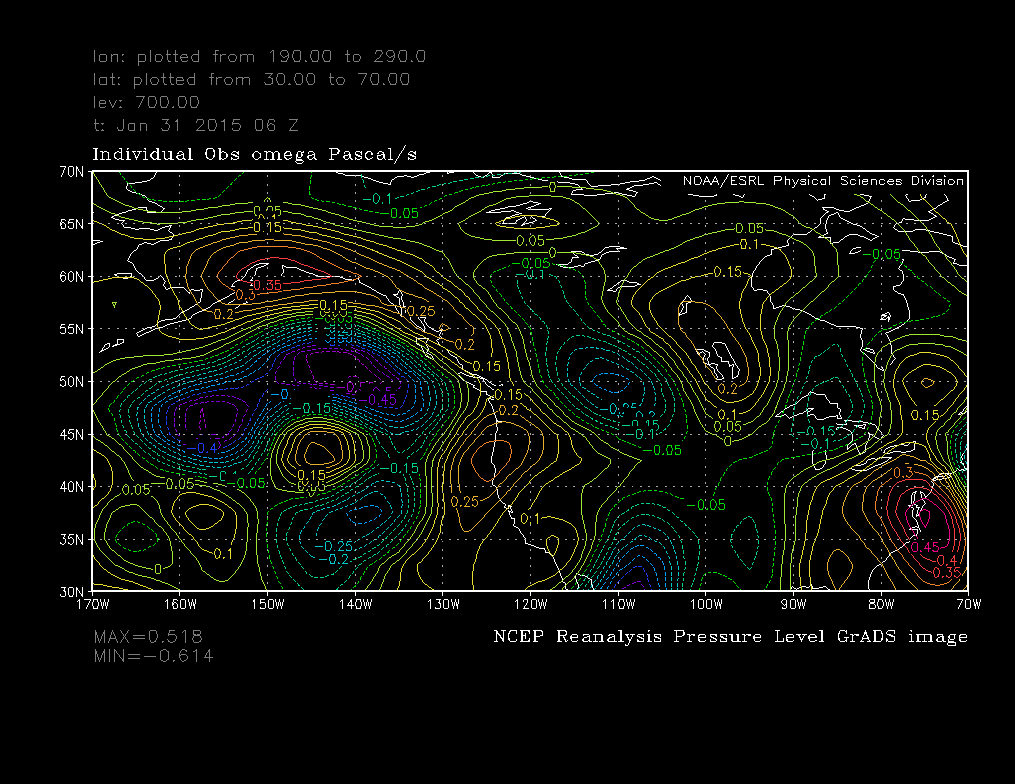
- NCEP Reanalysis 1 1948/01 to present, e.g. 700 hPa contours for 06Z Saturday 31 Jan. 2015 (and corresponding omega at 700 hPa).
- NCEP Reanalysis 1 (daily and monthly means for 1948/01 - present)
- NCEP Reanalysis 2 1979/01 to 2014/06.
- NOAA PSD (Physical Sciences Division) Interactive Plotting and Analysis Pages. Create (e.g.) charts of climatological mean height contours (and much else). Example: to create monthly mean 700 hPa height contours for Feb. 2011: → Interactive plotting and Analysis → Monthly/Seasonal Mean Composites or Daily Mean Composites
- NCEP Climate Forecast System Version 2 (CFSv2) 2011/01 to present (almost real time).
- NOAA's National Climatic Data Center (NCDC) NOMADS (Nat'l Op'l Model Archive & Distrib'n System). Links allow to rebuild an analysis or prog from archived data, with a wide range of variables to choose from, including vertical velocity veloc. Example (700 hPa analysis): Access → NAM → Near real time & historical NAM → Plot | FTP4u → pick time window → build order → plot data → Advanced users → next page → select fields eg. to get 700 hPa height contours select "geopotential height -[gpm] - 39 levels", select "draw lines"
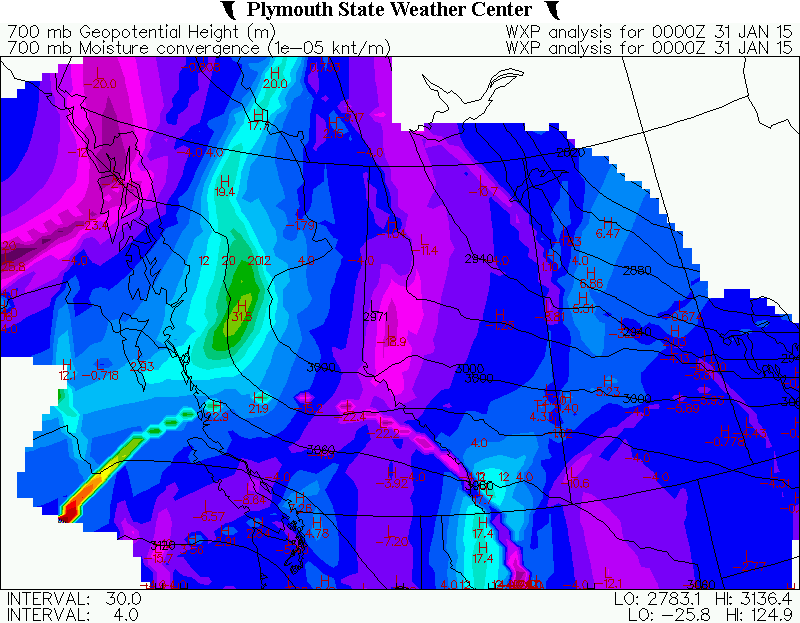
- Plymouth State Weather Centre allows to create synoptic charts for mandatory levels, 1998-present. Can plot a great variety of interesting meteorological fields, including divergence (but, curiously, not vertical velocity); and can include a secondary field. Usually best to make the height field the secondary field. Example, 700 hPa height and moisture convergence valid 00Z Saturday Jan. 31, 2015.
- Unisys Image and Map Archive, e.g. ETA and/or NAM 0h analysis in form of (garish) 4-panel colour charts back to 2004
- Accessing .grib files for the reanalyses
- via soostrc.comet.ucar.edu/data/grib/ (Available: cfsr, ecmwf, gfs, ice, nam, namak, narr, rap, ruc, sst)
- apps.ecmwf.int/datasets/data/interim_full_daily/ ECMWF interim reanalysis (global, 0.7 degree)
- http://nomads.ncep.noaa.gov/
- NWS DIFAX Weather Map Archive (full size)
- Archive of NCEP surface analyses (400 most recent; small charts)
- EC weather archive
- NCEP site to regenerate daily weather maps over N. America (archive to 2002; surface only, with fronts; maps do not cover north of 60oN). Also 7 day archive (archive to 2006; surface only, with fronts; option for maps covering entirety of N. America)
Parcel Trajectories (forward or backward in time)
Comprehensive Sites oriented to the (North American) General Public
Tools
On-line Case Studies of Weather Events
Miscellaneous sites/documents related to thermal soaring (hang gliding, paragliding, etc.)
Asia
Australia/New Zealand
Europe
Miscellaneous
- Worldwide Radiosonde Station List (with codes)
- Equilibrium vapour pressure table over a plane surface of liquid water. Here for sub-zero temperatures the equilibrium v.p. is computed with respect to water, which is the convention used with regard to the radiosonde data.
- Vapour pressure table (equilibrium vapour pressure over a plane surface of water or ice at the stated temperature; from Fritschen & Gay, "Environmental Instrumentation")
Back to the EAS372 home page.
Last Modified: 27 Apr., 2017