Windbreak Experiment, Ellerslie 2001
Objective
We performed gas dispersion trials, with the gas (methane) source within a shelter fence. A porous plastic shelter fence (height h=1.25 m, "resistance coefficient" kr=2.4) was erected in a square with 20 m side lengths . To interpret the gas dispersion data we needed to define the spatial pattern of the mean windspeed (S) and the turbulent kinetic energy (k).
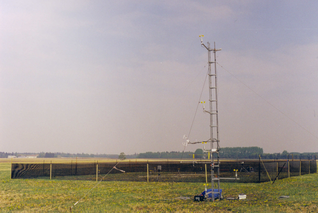
Instruments on the 6 m upwind tower determined the statistical "state" of the atmospheric surface layer upwind from the fence, a state expected to in equilibrium, due to the long passage over flat terrain. According to the Monin-Obukhov similarity theory, the upwind velocity statistics are fully determined by the friction velocity u*, the Obukhov length L, the surface roughness length z0, and the mean wind direction b. These state parameters may be determined in several fashions, and instruments on the tower provide some redundancy. At five levels (the lowest being z=0.65 m, or approximately z/h=0.5, where h is the fence height), the tower supported cup anemometers (giving speed S=(u2 + v2)1/2). A 3-dimensional sonic anemometer (at height z=2 m) gave all first and second-order statistics of the wind and temperature at that point. Temperature was measured at three levels by thermocouple junctions in ventilated radiation-shields.
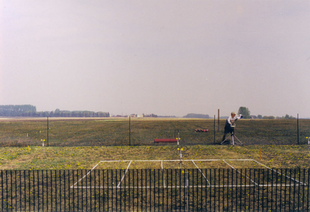 Inside the sheltered plot seven cup anemometers sampled the spatial pattern of the mean wind (15 minute averages).
Wind statistics in the plot were extremely sensitive to the mean wind direction relative to the fences (Wilson and Flesch, 2003). If wind approached the plot perpendicularly across (any) side, wind reduction was approximately the same as expected (Wilson, 1985; Wilson et al., 1990) for an infinite straight barrier, ie. fractional wind reduction at the most protected point behind the fence approximately
Inside the sheltered plot seven cup anemometers sampled the spatial pattern of the mean wind (15 minute averages).
Wind statistics in the plot were extremely sensitive to the mean wind direction relative to the fences (Wilson and Flesch, 2003). If wind approached the plot perpendicularly across (any) side, wind reduction was approximately the same as expected (Wilson, 1985; Wilson et al., 1990) for an infinite straight barrier, ie. fractional wind reduction at the most protected point behind the fence approximately
DS / S0 = kr / (1 + 2 kr)0.8
where S0 is the windspeed in the open (this formula applies at any height up to about z=h). However if the wind was oriented to approach the plot over a corner, wind reduction was observed only over a small fraction of the plot, with a zone of strong mean wind down the diagonal.
Acknowledgements
Research funding was provided by the Natural Sciences and Engineering Research Council of Canada (NSERC) and the Canadian Foundation for Climate and Atmospheric Sciences (CFCAS).
Back to the Earth & Atmospheric Sciences home page.
Last Modified: 15 Sept. 2005