Windbreak Experiment, Ellerslie 2003
Video of the experiment (6MB mpeg file)
- Wilson, J.D., 2004, Oblique, Stratified Winds about a Shelter Fence, I: Measurements J. Applied Meteorol., 43, 1149-1167.
- Wilson, J.D., 2004, Oblique, Stratified Winds about a Shelter Fence, II: Comparison of Measurements with Numerical Models. J. Applied Meteorol., 43, 1392-1409.
Description of the experiment
Broadly, the objective was to look at the spatial pattern of the mean windspeed (S) and the turbulent kinetic energy (k) in the lee of a windbreak of well-defined aerodynamic character. The site was a large flat field, and the fetch of uniform surface upwind from the tower extended about 400 m. The plastic windbreak fence was aligned north-south (y-axis), and was about 120 m long.
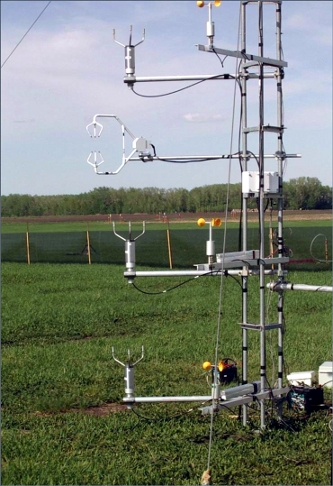
Upwind sensors
Instruments on the upwind tower shown at right determined the statistical "state" of the atmospheric surface layer upwind from the fence, a state expected to in equilibrium, due to the long passage over flat terrain. According to the Monin-Obukhov similarity theory, the upwind velocity statistics are fully determined by the friction velocity u*, the Obukhov length L, the surface roughness length z0, and the mean wind direction β. These state parameters may be determined in several manners, and instruments on the tower provide some redundancy.
At four levels (the lowest being z=0.62 m, or z/h=0.5, where h is the fence height), the 6m tower supports cup anemometers (giving speed S=(u2 + v2)1/2) paired with 2-dimensional (2D) sonic anemometers giving the horizontal velocity components u and v respectively perpendicular and parallel to the fence, and the wind direction β=atan(v/u). The single 3D sonic anemometer (at height z=2 m) gives all first and second-order statistics of the wind and temperature at that point. Temperature is measured at three levels by thermocouple junctions in ventilated radiation-shields.
The fence
The plastic fence is h=1.25 m high, has a porosity of 45%, and a "resistance coefficient" kr=2.4. From numerical solutions of the momentum equations (Wilson, 1985; Wilson et al., 1990), it is expected that under neutral stratification and for winds perpendicular to the fence (ie. west winds, wind direction β=270o) the fractional wind reduction at the most protected point behind the fence should obey
ΔS / S0 = kr / (1 + 2 kr)0.8
where S0 is the windspeed in the open (this formula applies at any height up to about z=h). We shall see below that the experimental results nicely confirm this formula.
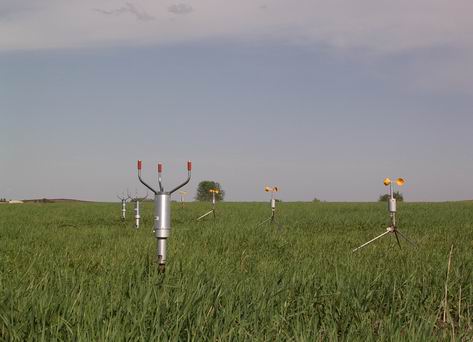
Anemometers Downwind
Downwind from the fence, cup and sonic anemometers are placed along a perpendicular line (x-axis, east-west) lying about midway between the ends of the fence. The principle of symmetry implies that far from the ends of the fence, and not too far downwind, the statistical pattern of the wind should be invariant along the y-direction, that is, along the fence. End effects will occur at smaller and smaller downwind distance x, as the mean approach angle of the wind (β) increases.
The image below shows a close-up of some of the 7 cup anemometers and five sonic anemometers that are arrayed downwind. All are at height z=0.62 m (z/h = 0.5). Again, the 2D sonics are paired with cup anemometers, because a side aspect of the experiment is to determine whether the simpler mechanical anemometers are responding accurately in the highly turbulent near-ground flow; this is important because many earlier windbreak experiments have used cup anemometers, and these are known to "overspeed" in turbulence. Early results from the present experiment have shown that these cups overspeed by a factor between 10-15%, and that the assumption of a constant overspeeding factor 1.12 would be adequate.
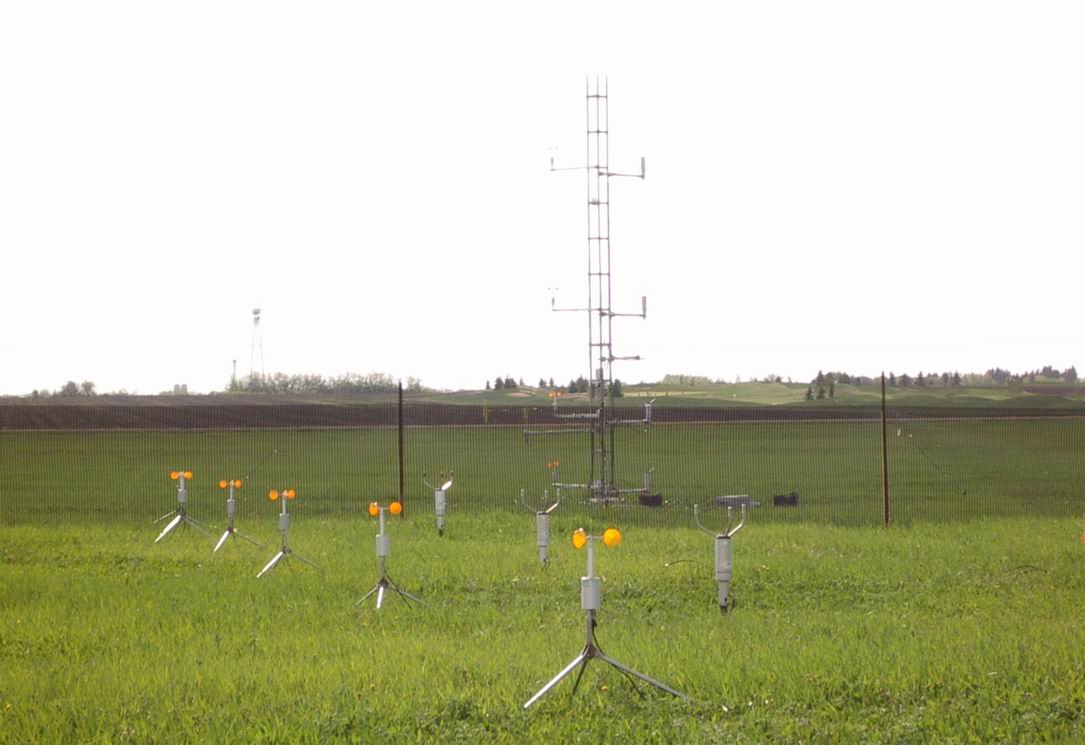
 A telephoto shot looking WNW across the site of the windbreak experiment shows that the site is flat for a distance of several hundred meters upwind from the fence - a golf course may be seen in the distance, but the influence on the windbreak flow of the rolling terrain at that distance ought to be negligible.
Preliminary Results
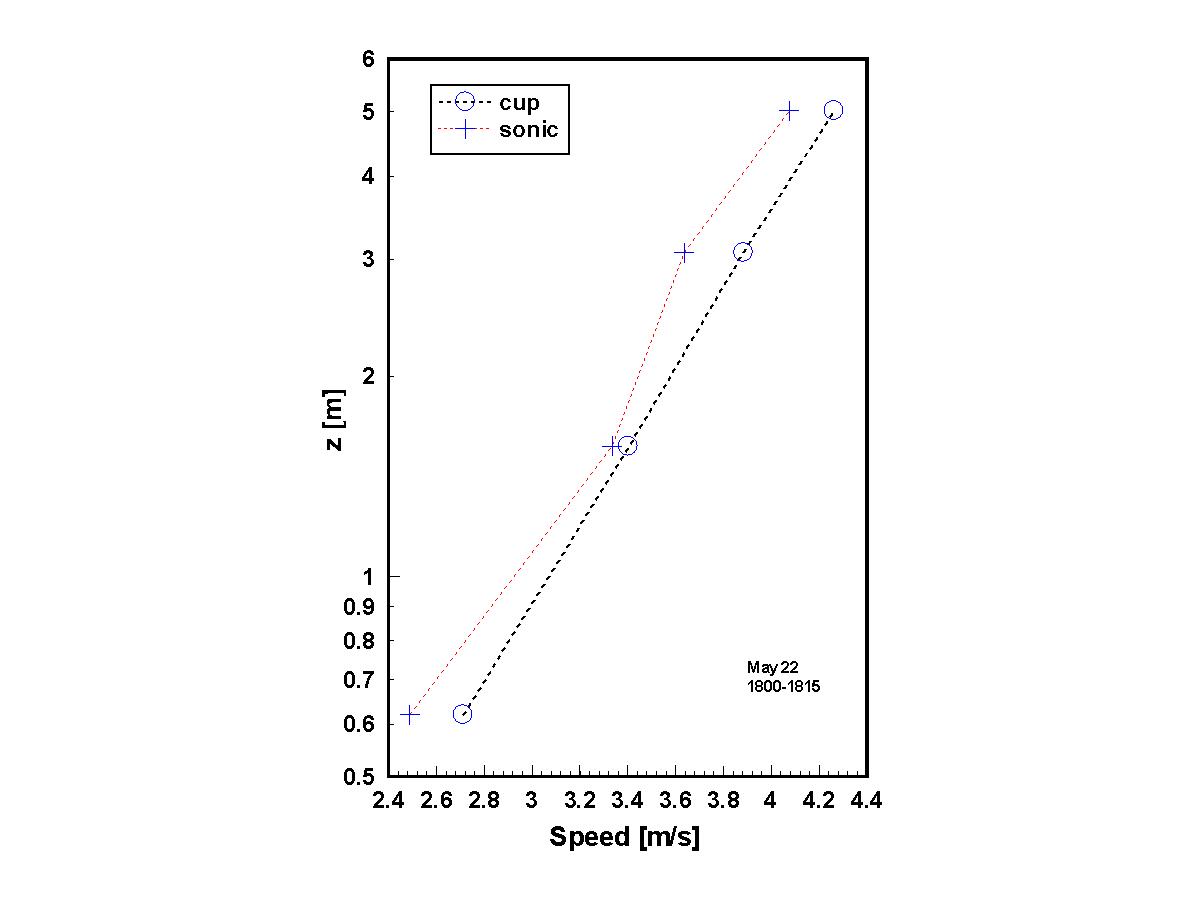
- Comparison of cup and sonic anemometers in the upwind equilibrium wind. This is a near neutral wind profile, and here and elsewhere average is over 15 minutes.
The 2D sonic anemometers read lower speeds than the cups, which is unsurprising as it has long been known that cups "overspeed" in a turbulent wind. However note that the cups report the expected straight-line S versus log(z) relationship, whereas the 2D sonics report a somewhat erratic (and therefore erroneous) wind profile. The same "raggedness" of the 2D sonic profiles has been seen in all (of the rather few) profiles so far inspected, but, the "most unbelievable" sonic is not always that at the second level, and this provides a clue.
On first thought one may suspect here a systematic miscalibration (these are new instruments; no adjustment of the manufacturer's calibration was made). However a possible alternative explanation is as follows. The sampling interval for the sonics could not be reduced below 8 seconds, giving just over 110 independent samples per each 15 minute average, and the sonics have no mechanical inertia to smooth the signal. From the Central Limit Theorem we may expect with 95% probability that the sampling error of the mean is less than 2σ/(110)1/2, where σ is the standard deviation of the windspeed. If we estimate the latter as about 1 m/s, then with 95% probability, sampling error of the mean windspeed from the sonics should be less than 0.2 m/s. Random sampling errors in the sonic mean windspeed of order 0.1 m/s are, therefore, to be expected, and probably explain the ragged wind profiles from the sonics.
- Unusual states of the hh_ASL. During some intervals, mean wind directions from the 2D sonic, vane and 3D sonic are bafflingly different from each other. This will be interesting to pursue.
- Comparison of cup and sonic anemometers in the disturbed flow; wind reduction curves from cup anemometers (circles) and from 2D acoustic anemometers (squares) at z/h=0.5. The cup overspeeding errors are not substantially larger in the lee of the windbreak than in the undisturbed approach flow. Thus the cheaper, simpler cup anemometers, whose condition is easier to assess than that of the sonic anemometers, are adequate if one's interest is merely the speed of the wind.
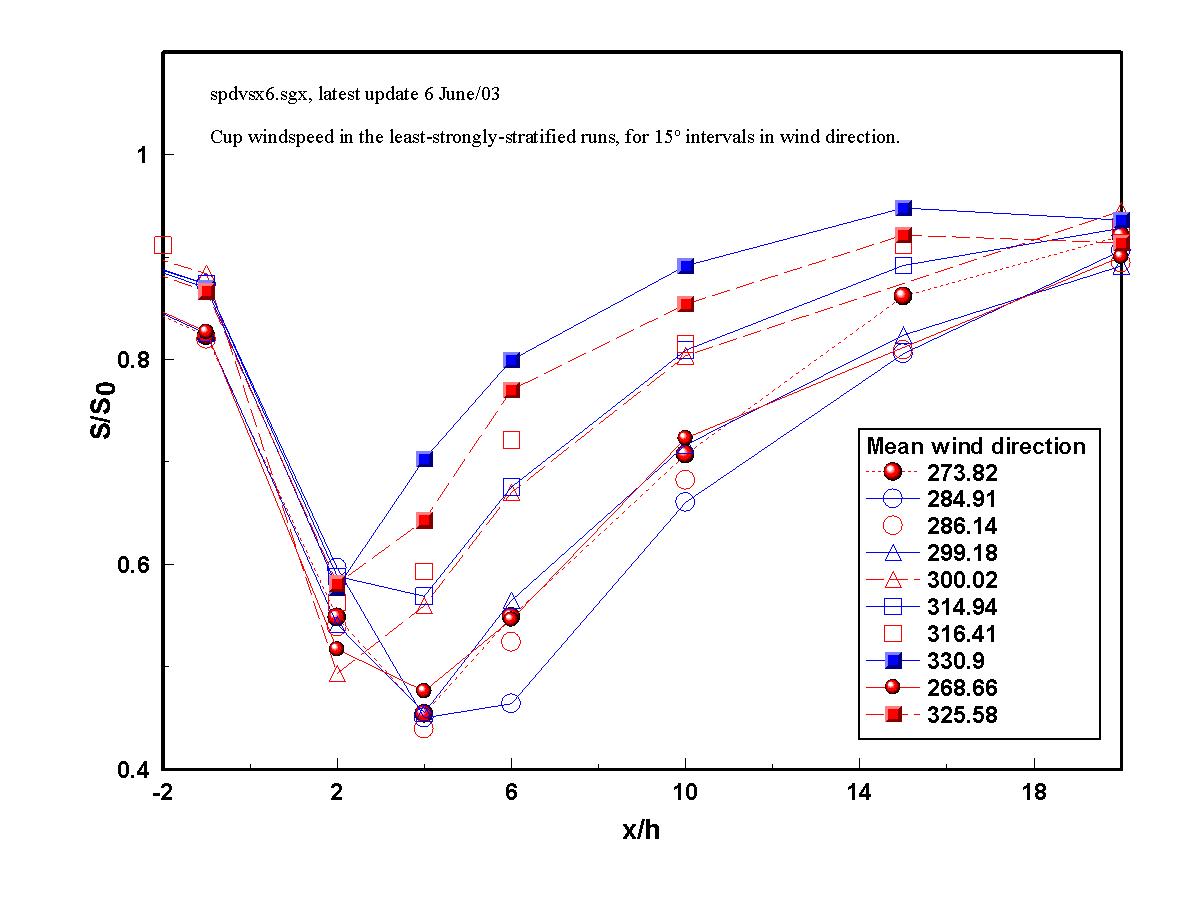
- Influence of wind direction on the wind reduction curve. These data stem entirely from the cup anemometers, and data have been "normalized" as S/S0 where S0 is the 15 minute mean windspeed reported by the lowest cup anemometer on the tower, ie. in the approach flow.
Better wind reduction is seen when the wind approaches the barrier within about 30o from perpendicular incidence; and at perpendicular incidence the observed speed reduction (about 55% so that the minimum windspeed is about 45% of the windspeed in the open) closely matches that expected from the formula given above.
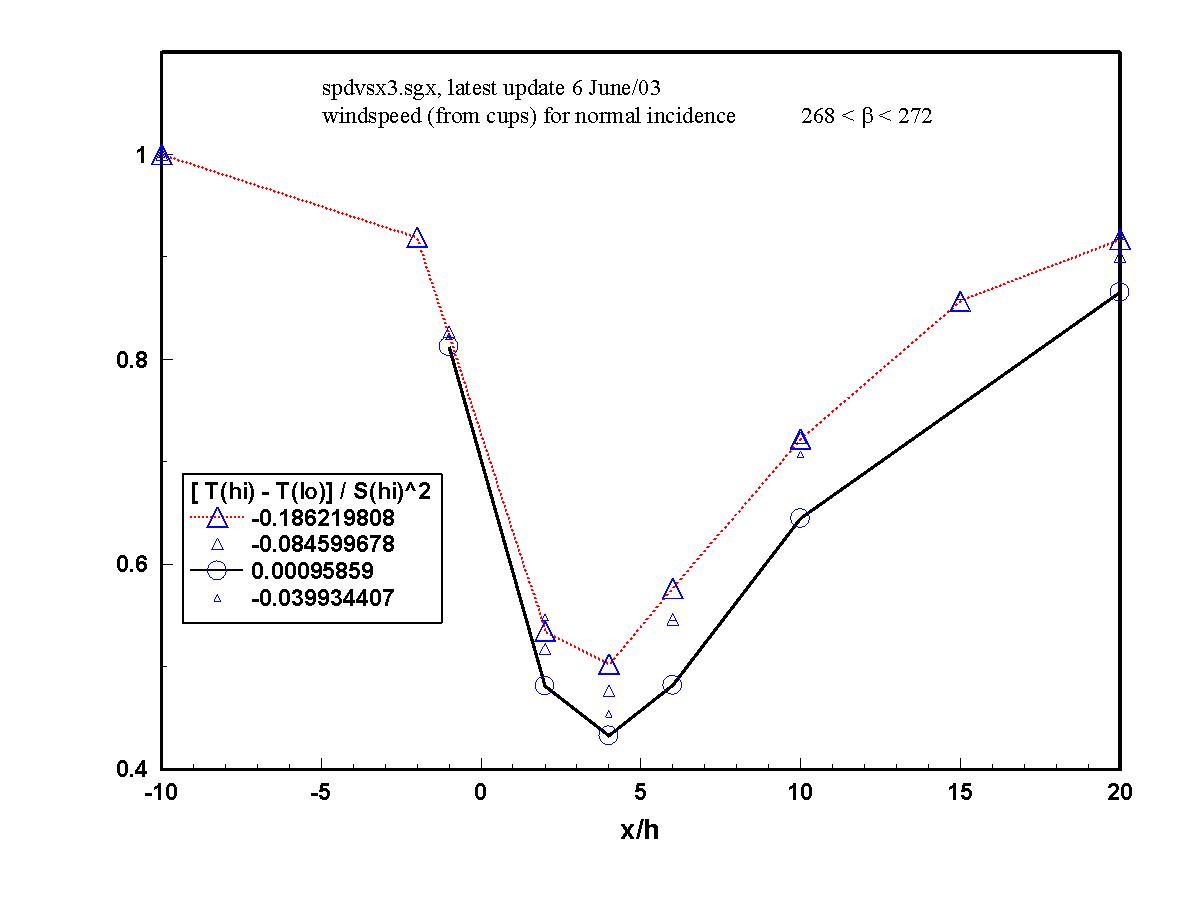
- Influence of atmospheric stratification on the wind reduction curve for runs having mean wind direction within 2 degrees from the normal to the fence. Symbols differentiate the unstable cases (upward-pointing triangles); neutral cases (circles); and stable cases (downward-pointing triangles). The stratification parameter (on this first pass through the data) is proportional to a bulk Richardson number, and computed as the temperature difference (top minus bottom) along the tower, divided by the square of the mean windspeed at the top of the tower. Note the systematically better shelter as we pass from unstable conditions towards neutrality. It remains to add the data from the 2D sonics.
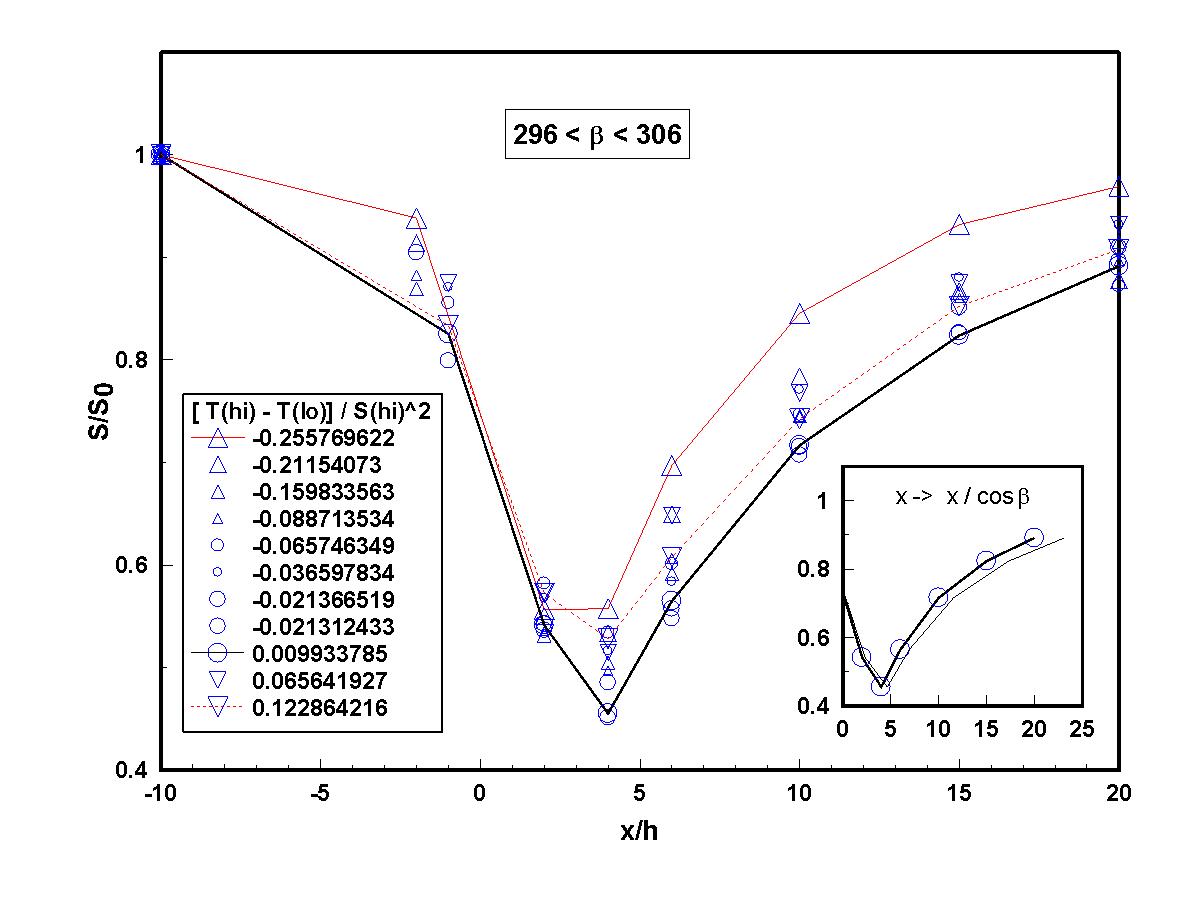
- Influence of atmospheric stratification on the wind reduction curve for runs having mean wind direction about 30o away from the normal to the fence. Again, wind reduction is markedly better in neutral stratification than either unstable or stable stratification. The insert showing the neutral case, when compared with the wind reduction curve for perpendicular winds, indicates that the effect of mean wind direction on the wind reduction curve is not merely a trivial alteration of the alongwind distance x/cos(|β-270|) increasing as wind direction increases.
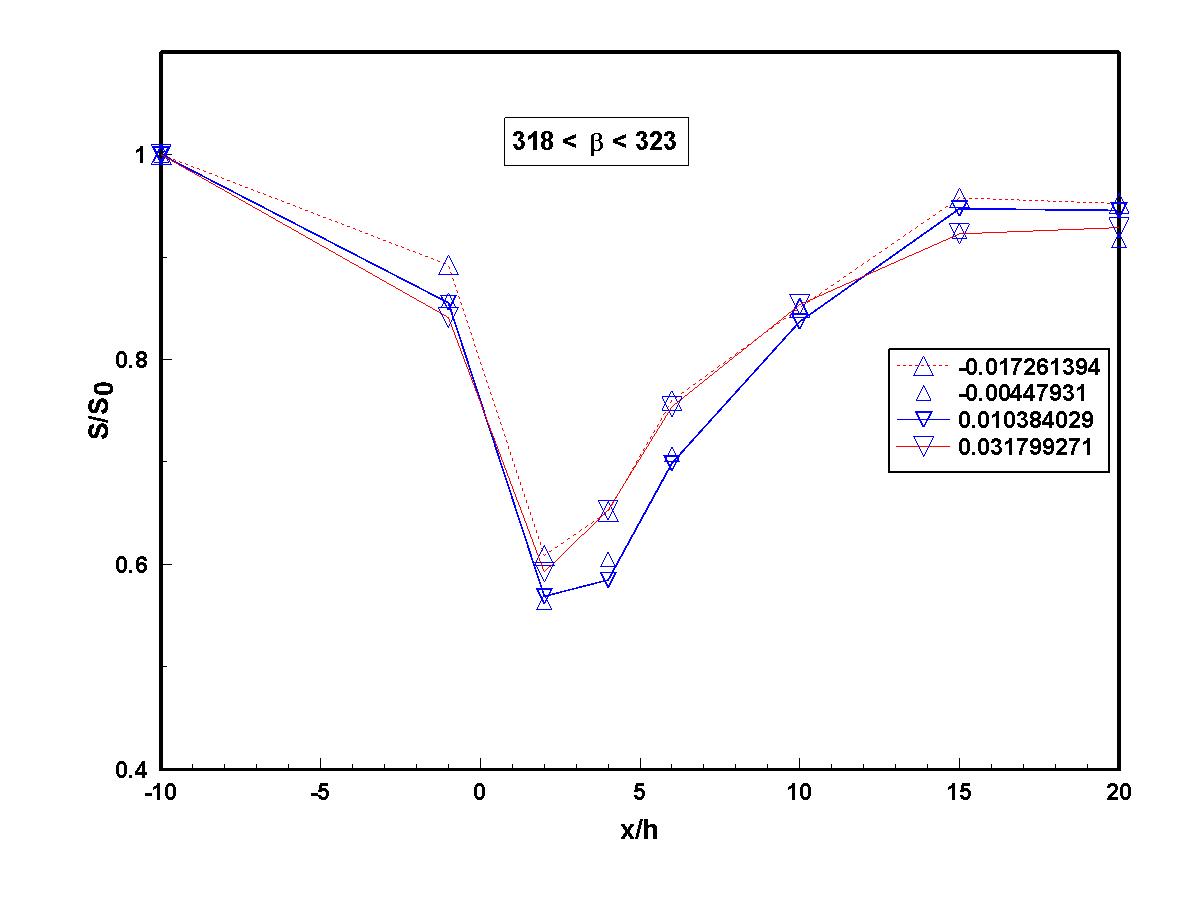
- Influence of atmospheric stratification on the wind reduction curve for runs having mean wind direction about 50o away from the normal to the fence. For winds approaching at this oblique angle, a narrower range in the stability index has so far been sampled. However unambiguously, stratification of either sign reduces wind reduction.
Comments
- Availability of the multiple estimates of mean wind direction (vane; four 2D sonics; 3D sonic) was crucially useful in identifying intervals when upwind mean wind direction was non-uniform. Invariably the windspeed reduction curves associated with such runs were baffling, until this information was perused. Such runs have been rejected.
Follow-up Research (work since completed)
The Reynolds equations (a set of about 16 partial differential equations expressing conservation of momentum, air mass, water vapour mass, and thermodynamic energy), closed at second order, will be integrated numerically in three space dimensions to provide theoretical spatial fields of velocity, temperature, and turbulent kinetic energy. These will be compared with the measurements to determine the adequacy of the "closure assumptions" (empirical relationships that supplement the Reynolds equations to ensure there are as many equations as unknowns).
Acknowledgements
Research funding is provided by the Natural Sciences and Engineering Research Council of Canada (NSERC) and the Canadian Foundation for Climate and Atmospheric Sciences (CFCAS).
Back to the Earth & Atmospheric Sciences home page.
Last Modified: 6 June, 2013