As requested, students included an Introduction and a Conclusion; however it was as if writers had depended on this formula: Introduction? - let's paraphrase the instructions given by the instructor. Conclusion? - let's summarize the results. Your Intro. and Conclusion may appropriately have something of that character, but this wouild be a bare minimum. Try to go beyond this: take the chance to communicate your engagement with the material, your interest, and display your writing aptitude.
Surprisingly, on the final question not a single student cited the surface energy balance
JW was remiss in not having posted writing guidelines for Assignment 1 (an oversight), and so the writing element has not (per se) been scored. Future lab reports ought to feature an Introduction, some verbal guidance to a reader, and some reaction to (or interpretation of) results. Remaining assignments will require those elements... see suggestions on assignment writing.
Soundings:
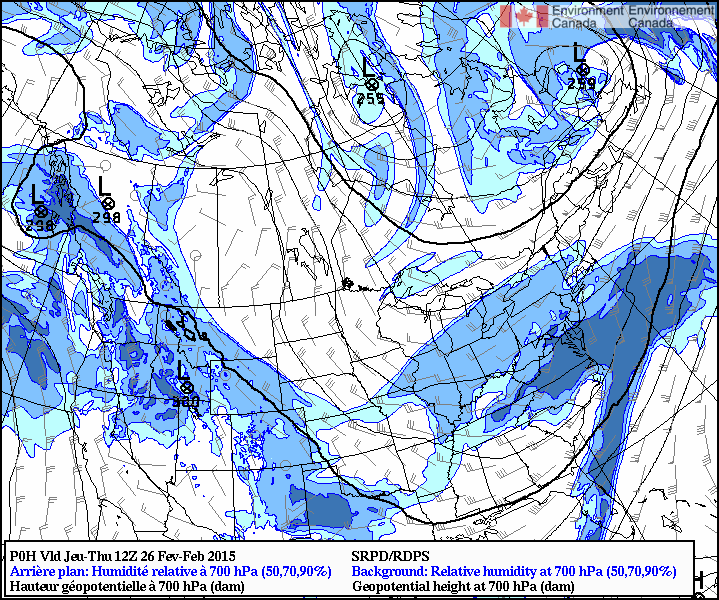
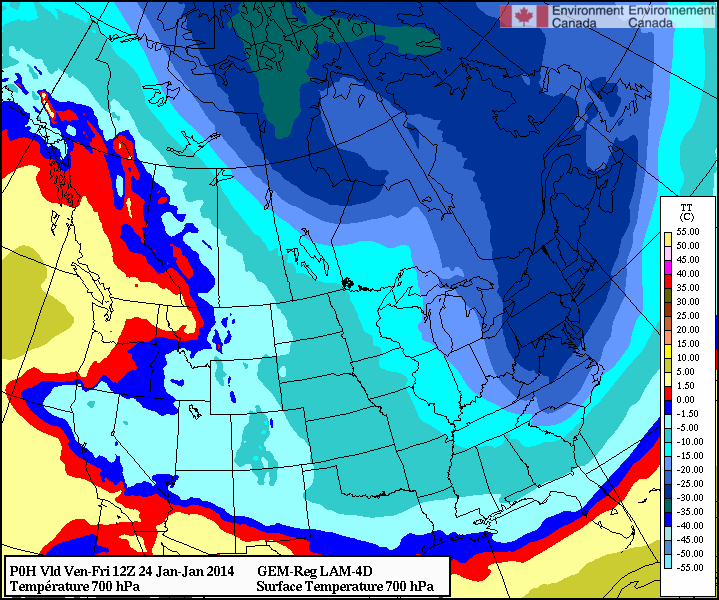
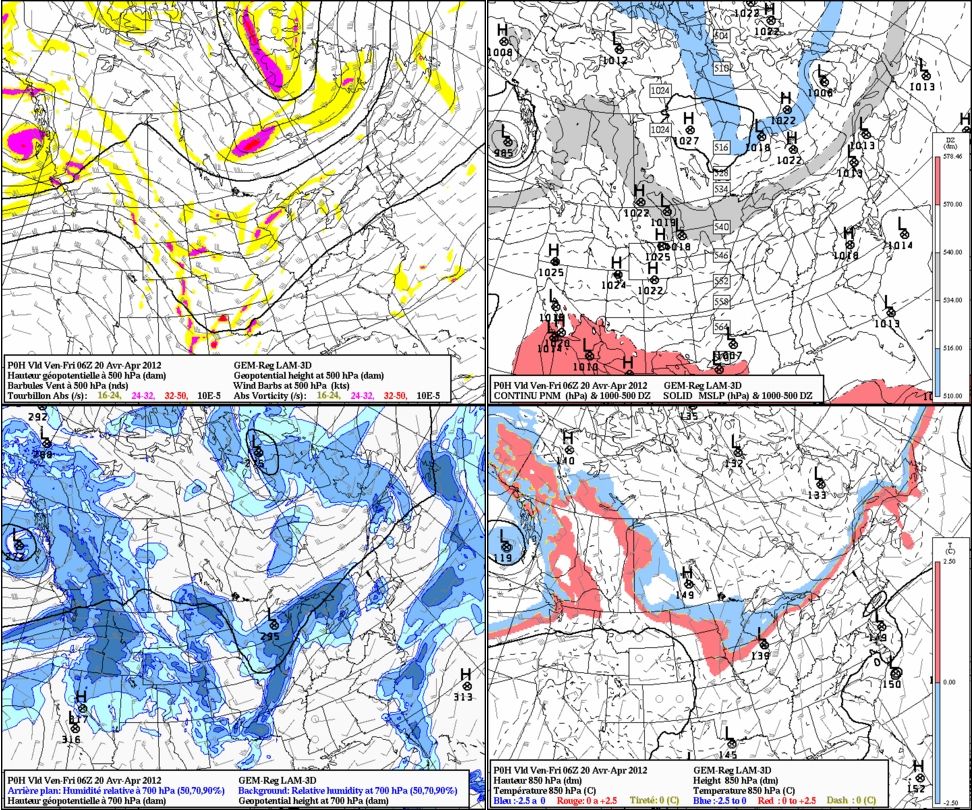
The Pas, Manitoba (YQD): Skew-T diagram, sounding data and schematic (two-point) hodograph. Evidently there is no directional shear between 850 and 500 hPa, but the strength of the wind increases. The thermal wind, therefore, is a nor-wester (i.e. oriented at 325o). A comparison with the isobaric charts shows that such an orientation means the thermal wind is more or less parallel to the isotherms at each of the mandatory levels (850, 700, 500 hPa). These analyses confirm the expectation that colder air should lie to the "left" of the thermal wind vector (i.e. on your left hand if you are "riding" the wind and facing forward towards your destination). The absence of directional shear (i.e. absence of turning of the wind vector with increasing height) means that thermal advection is weak or non-existent -- as also evident from the isobaric charts.
Mount Pearl, Newfoundland (AYT): Skew-T diagram and sounding data. Again, the absence of directional shear is striking, but the speed increases greatly with increasing height. In the classic terminology, the thermal wind is a "west sou-westerly" (WSW), compatible with milder air lying to the SSE -- which is what we indeed see on the isobaric charts.
Please notice that on the isobaric charts lines of constant latitude are not straight lines, nor are they everywhere parallel to the edge of the paper. This matters greatly when it comes to naming the wind direction.
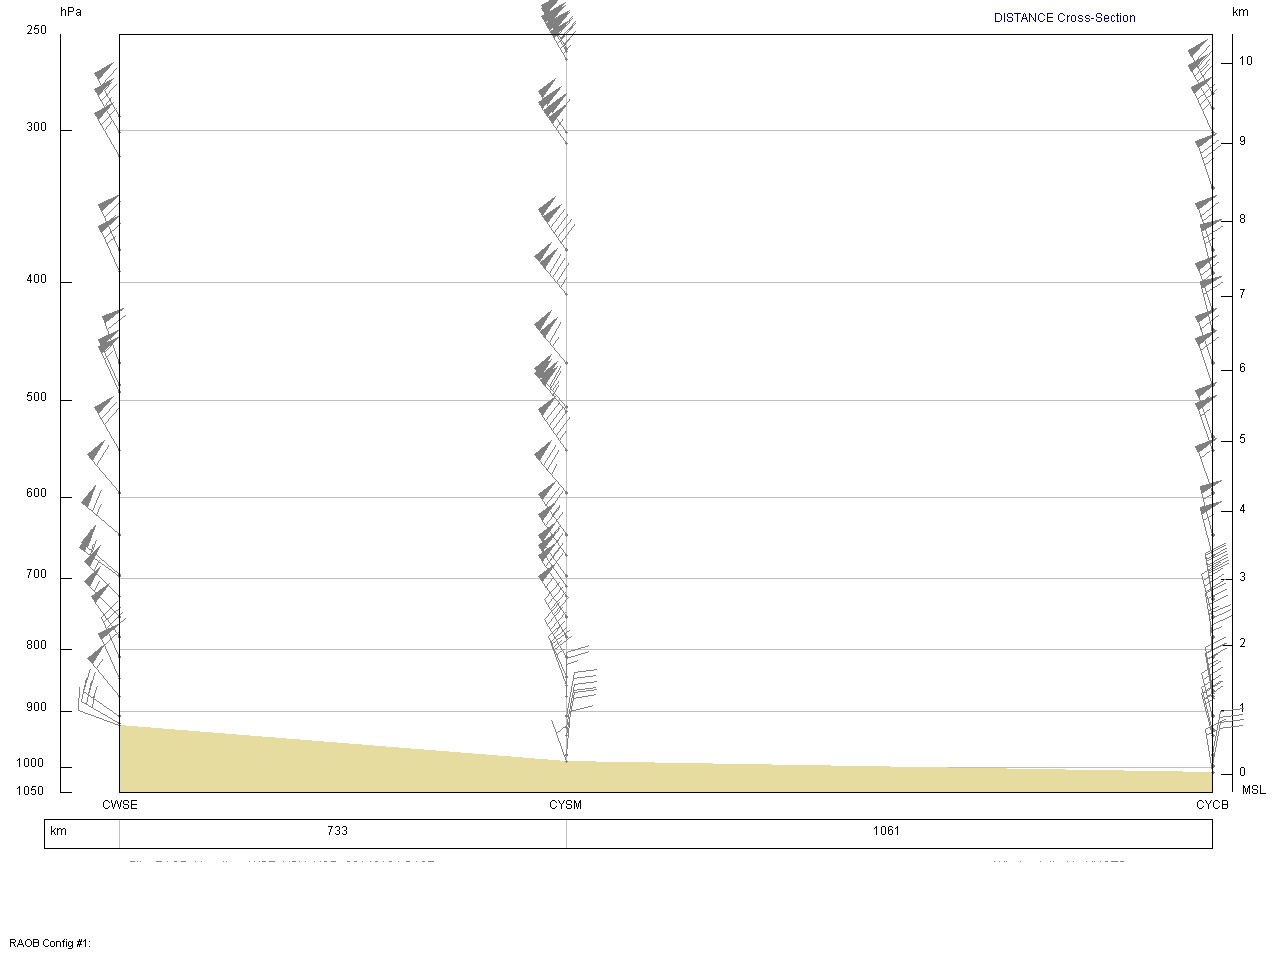
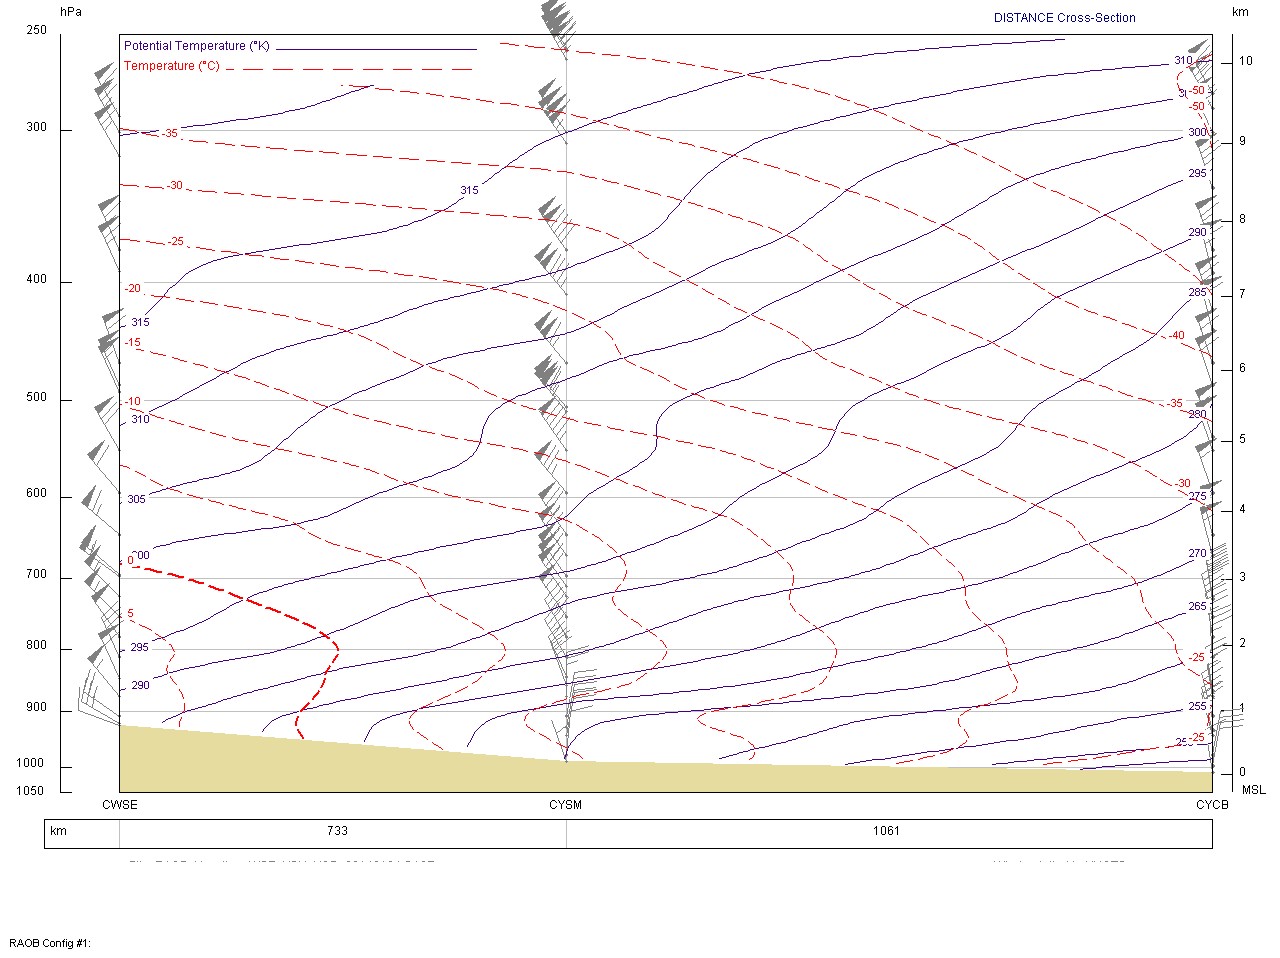
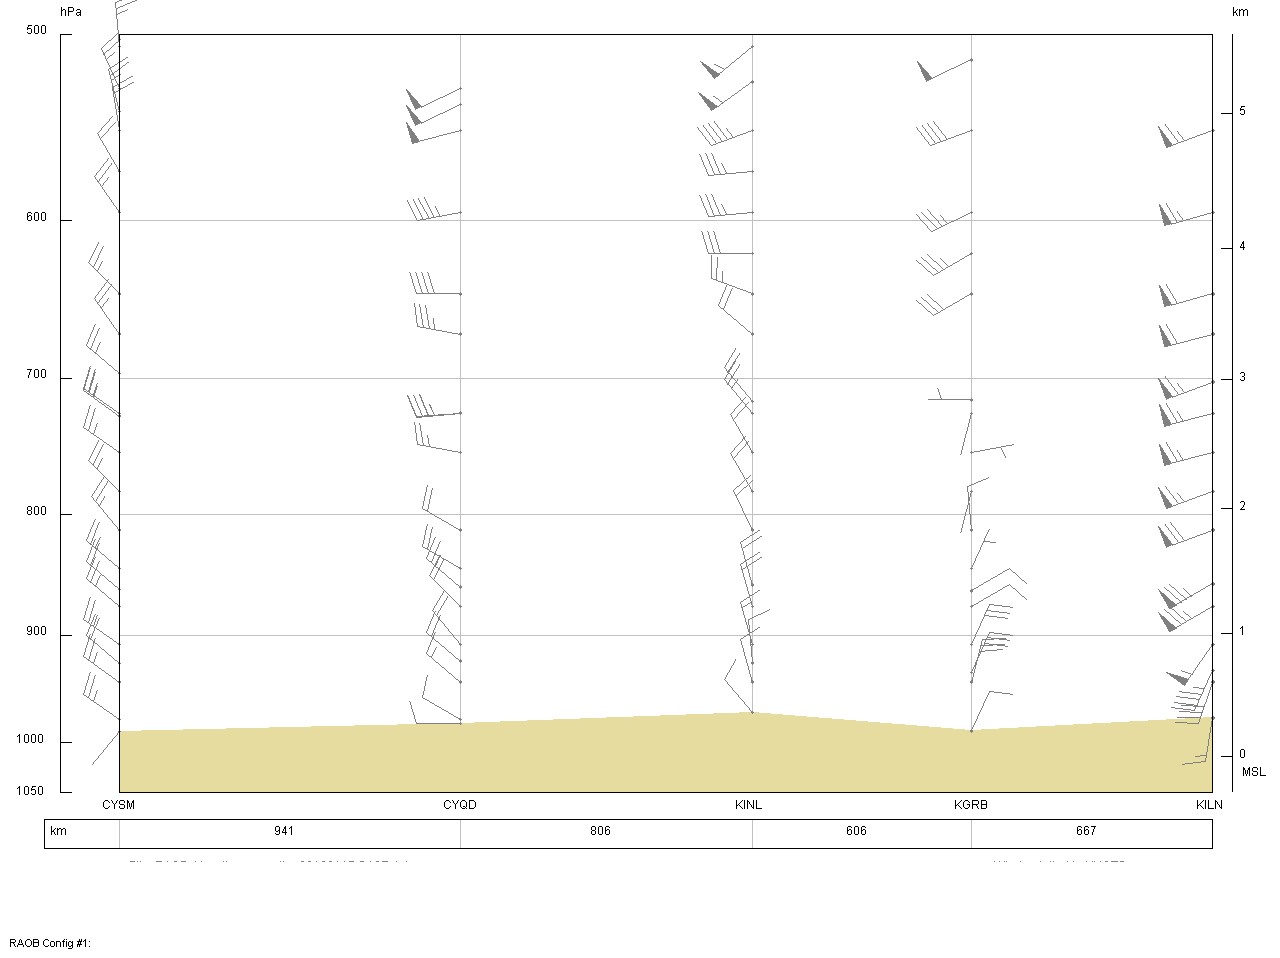
RAOB's version of the cross-section shows some complex curving of the isolines whose origin is obscure -- perhaps RAOB's analysis incorporates some physics rather than being based strictly and solely on interpolation of the raw sounding data. In any case, it cannot be regarded as a criterion for correctness of the student cross-sections, except in the broadest sense. Criteria:
No glaring errors of isoline placement -- correct intersections, overall slopes
The -5oC isotherm intersects the ground between WSE and YSM
At YSM the -10oC isotherm should cross at least twice - just below 600 hPa and above 900 hPa
the -15oC & -20oC isotherms intersect the ground between YSM and YCB
the -30oC isotherm crosses YCB at two levels (near 660 hPa and near the surface)
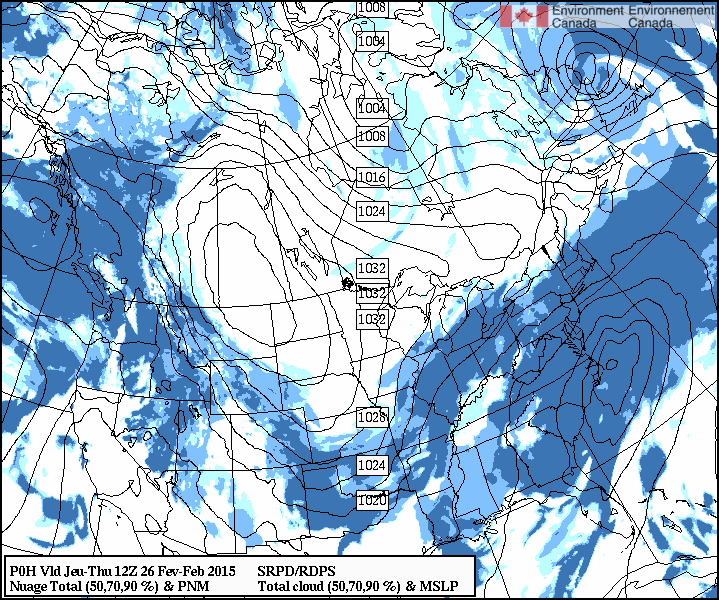
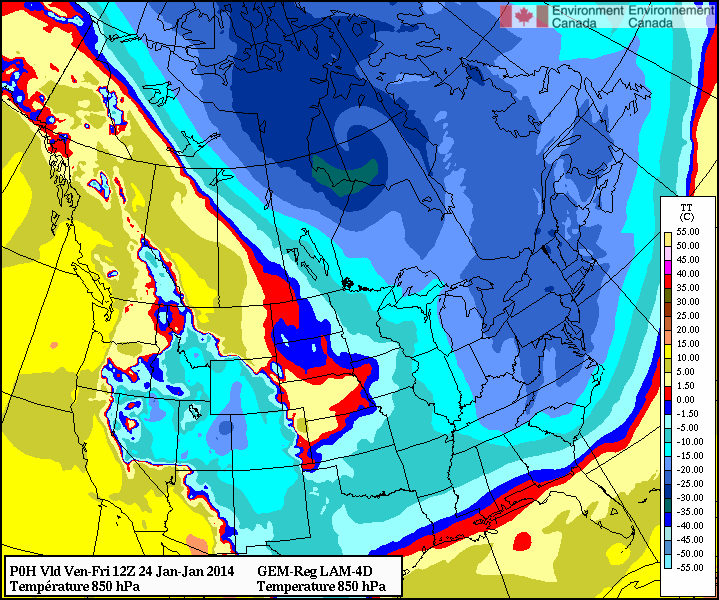
Interpretation: atmosphere stable all along the cross-section (θ everywhere increasing with increasing height), but low level temperature (say, below roughly 850 hPa) considerably milder at the southern end of the transect (one could have pointed out that this is exactly what we see on the CMC 850 hPa analysis).
The question asked was the number of days during 1-10 Feb. 2014 at Toronto Int'l Airport (YYZ) whose max/min were below normal, normal and above normal. A tabular presentation would therefore be economical.
Variable
Below normal
Normal
Above normal
Min. temp*
8
1
1
Max. temp**
8
2
0
*33rd and 66th percentiles for the minimum are -12.8oC and -6.5oC
**33rd and 66th percentiles for the maximum are -3.3oC and +1.5oC
In the sounding files the columns are: pressure, height ASL, temperature, dewpoint, wind direction, wind speed [m/s]. Sounding temperatures and dewpoints must be divided by 10, and 32767 indicates missing data.